|
4.3 Perception of Problem by Teachers from
Different Background
To compare the perception of the problems encountered by
teachers using CMI from different backgrounds, a score on a scale of 1
to 3 was arranged to reflect the seriousness of the problem. A variable,‘Overall
Problem’, was constructed to represent individual teachers’ overall impressions
of the problem. The score for Overall Problem was obtained by adding the
scores of the five problem areas (Q.11a to Q.15a) and dividing by 5, resulting
in a score ranging from 1 to 3.
4.3.1 Teachers from
CMI schools versus teachers from EMI schools
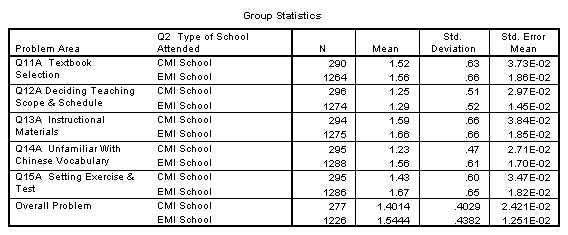
Independent sample T-tests were employed to test the hypothesis
that there is no difference in perceived problems (represented by Q.11a
to Q.15a and the Overall Problem) between the captioned groups of teachers.
Results of the analysis show that the problem intensity scores obtained
by teachers from EMI schools are higher than those of their counterparts
in all problem areas. (See Table 4.3.1.) In particular, the difference
is statistically significant for Q.14a, Q.15a and‘Overall
Problem.’* It was noted that Q.14a and Q.15a
represent areas which involve teachers’ mastery of language, general as
well as academic. Therefore, the picture seems to suggest that because
of the difference in their prior academic training, teachers who are EMI
school graduates perceive greater problems in this MOI change than their
counterparts.
*See Table 4.3.1, for Q14a, t
= -10.300, df = 550.346; for Q.15a, t = -5.777, df = 1579; for Overall
Problem, t = -5.245, df = 436.223; all significant with p < .000 2-tailed.
Table 4.3.1: t-test on Perceived Problem between
Teachers from CMI Schools and Those from EMI Schools
Independent Samples Test
|
Problem area
|
Levene’s Test for Equality of Variances
|
t-test for Equality of Means
|
|
F
|
Sig.
|
t
|
df
|
Sig. (2-tailed)
|
Mean
Difference |
Std.Error Difference
|
95% Confidence Interval of the
Difference
|
|
Lower
|
Upper
|
| Q11A
Textbook Selection |
Equal variances
assumed |
1.619
|
.203
|
-1.057
|
1552
|
.291
|
-4.53E-02
|
4.28E-02
|
-.13
|
3.87E-02
|
| Equal variances
not assumed |
|
|
-1.086
|
445.403
|
.278
|
-4.53E-02
|
4.17E-02
|
-.13
|
3.66E-02
|
| Q12A
Deciding Teaching Scope and Schedule |
Equal variances
assumed |
3.504
|
.061
|
-1.175
|
1568
|
.240
|
-3.91E-02
|
3.33E-02
|
-.10
|
2.62E-02
|
| Equal variances
not assumed |
|
|
-1.183
|
446.105
|
.237
|
-3.91E-02
|
3.30E-02
|
-.10
|
2.58E-02
|
| Q13A
Instructional Materials |
Equal variances
assumed |
.192
|
.662
|
-1.703
|
1567
|
.089
|
-7.27E-02
|
4.27E-02
|
-.16
|
1.10E-02
|
| Equal variances
not assumed |
|
|
-1.706
|
439.051
|
.089
|
-7.27E-02
|
4.26E-02
|
-.16
|
1.11E-02
|
| Q14A
Unfamiliar with Chinese Vocabulary |
Equal variances
assumed |
162.834
|
.000
|
-8.723
|
1581
|
.000
|
-.33
|
3.78E-02
|
-.40
|
-.26
|
| Equal variances
not assumed |
|
|
-10.300
|
550.346
|
.000
|
-.33
|
3.20E-02
|
-.39
|
-.27
|
| Q15A
Setting Exercise & Test |
Equal variances
assumed |
4.407
|
.036
|
-5.777
|
1579
|
.000
|
-.24
|
4.15E-02
|
-.32
|
-.16
|
| Equal variances
not assumed |
|
|
-6.112
|
469.629
|
.000
|
-.24
|
3.92E-02
|
-.32
|
-.16
|
|
Overall Problem
|
Equal variances
assumed |
7.243
|
.007
|
-4.974
|
1501
|
.000
|
-.1429
|
2.873E-02
|
-.1993
|
-8.7E-02
|
| Equal variances
not assumed |
|
|
-5.245
|
436.223
|
.000
|
-1.429
|
2.725E-02
|
-.1965
|
-8.9E-02
|
4.3.2 Teachers attended CMI
training programs versus teachers who have not
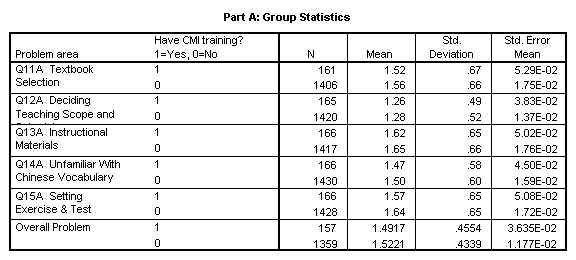
Similarly, t-tests were applied to examine the difference
in perceived problems between the captioned groups of teachers. The results
of the analysis indicate that teachers without any CMI training perceive
greater problems in all areas than teachers who have had training (see
Table 4.3.2 Part A). The differences are, however, not statistically significant
(see Table 4.3.2 Part B). In interpreting the statistical results, we
may note that the two groups are very different in size. The percentage
of teachers with CMI training is only about 10% of those without. This
difference may have offered the outcome of significance testing. Even
though the results are not statistically significant, we may still note
the higher problem intensity scores of teachers without CMI training,
and tentatively infer that teachers with CMI training are more prepared
to face the change.
Table 4.3.2: t-test on Perceived Problem
between Teachers With and Without CMI Training
Part B: Independent Samples Test
|
Problem area
|
Levene’s Test for Equality of Variances
|
t-test for Equality of Means
|
|
F
|
Sig.
|
T
|
Df
|
Sig. (2-tailed)
|
Mean Difference
|
Std. Error Difference
|
95% Confidence Interval of the
Difference
|
|
Lower
|
Upper
|
| Q11A Textbook
Selection |
Equal variances assumed |
.95
|
.757
|
-.669
|
1565
|
.504
|
-366E-02
|
5.47E-02
|
-.14
|
7.07E-02
|
| Equal variances not assumed |
|
|
-.656
|
196.606
|
.512
|
-3.66E-02
|
5.57E-02
|
-.15
|
7.34E-02
|
| Q12A Deciding
Teaching Scope and Schedule |
Equal variances assumed |
1.009
|
.315
|
-.481
|
1583
|
.631
|
-2.04E-02
|
4.24E-02
|
-.10
|
6.28E-02
|
| Equal variances
not assumed |
|
|
-.500
|
208.472
|
.617
|
-2.04E-02
|
4.07E-02
|
-.10
|
5.99E-02
|
| Q13A Instructional
Materials |
Equal variances assumed |
.146
|
.702
|
-.557
|
1581
|
.578
|
-3.02E-02
|
5.42E-02
|
-.14
|
7.62E-02
|
| Equal variances not assumed |
|
|
-.567
|
207.688
|
.571
|
-3.02E-02
|
5.32E-02
|
-.14
|
7.47E-02
|
| Q14a Unfamiliar
with Chinese Vocabulary |
Equal variances assumed |
.994
|
.319
|
-.597
|
1594
|
.550
|
-2.94E-02
|
4.92E-02
|
-.13
|
6.72E-02
|
| Equal variances not assumed |
|
|
-.617
|
208.745
|
.538
|
-2.94E-02
|
4.77E-02
|
-.12
|
6.46E-02
|
| Q15A
Setting Exercises & Test |
Equal variances
assumed |
.137
|
.711
|
-1.230
|
1592
|
.219
|
-6.57E-02
|
5.34E-02
|
-.17
|
3.90E-02
|
| Equal variances not assumed |
|
|
-1.225
|
204.785
|
.222
|
-6.57E-02
|
5.36E-02
|
-.17
|
4.01E-02
|
| Overall Problem |
Equal variances assumed |
.506
|
.477
|
-.828
|
1514
|
.408
|
-3.04E-02
|
3.676E-02
|
-.1025
|
4.17E-02
|
| Equal variances not assumed |
|
|
-.796
|
190.186
|
.427
|
-3.04E-02
|
3.821E-02
|
-.1058
|
4.49E-02
|
4.3.3 Teachers who used to use more
English versus teachers who used less
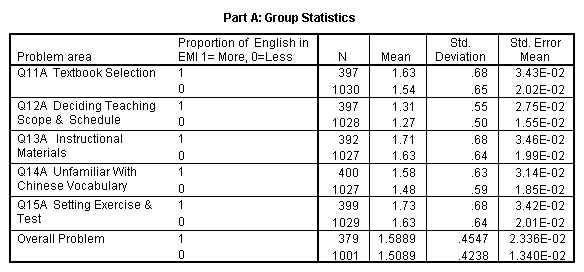
Respondents were divided into two groups according to their
response to Q.9 of the Teacher Questionnaire. Teachers who claimed to
use English for 51% or more of class time were combined into one group
(the‘More English’ group) while those who use
less English were combined into another (the‘Less
English’ group).
Independent samples t-test were applied to examine the difference
in perceived problems between the two groups. The results of the analysis
show that the mean score of the More English group is higher than that
of the Less English group in all problem areas. (See Table 4.3.3, Part
A.) In particular, the difference is statistically significant at p =
.05 2-tailed in Q.11a, Q.14a, Q.15a, and Overall Problem. *
*See Table 4.3.3 Part B; for Q.11a,
t = 2.265, df = 1425; for Q14a, t = 2.630, df = 690.673; for Q.15a, t
= 2.465, df = 1426; for Overall Problem, t = 3.068, df = 1378
Table 4.3.3 t-test on Difference in Perceived Problem
between the ‘More English’ Group and the‘Less
English’ Group
Part B: Independent Samples
Test
|
Problem area
|
Levene’s Test for Equality of Variances
|
t-test for Equality of Means
|
|
F
|
Sig.
|
T
|
df
|
Sig. (2-tailed)
|
Mean Difference
|
Std. Error Difference
|
95% Confidence Interval of the
Difference
|
|
Lower
|
Upper
|
| Q11A Textbook
Selection |
Equal variances assumed |
1.996
|
1.58
|
2.265
|
1425
|
.024
|
8.80E-02
|
3.88E-02
|
1.18E-02
|
.16
|
| Equal variances not assumed |
|
|
2.212
|
686.640
|
.027
|
8.80E-02
|
3.98E-02
|
9.90E-03
|
.17
|
| Q12A Deciding
Teaching Scope & Schedule |
Equal variances assumed |
7.553
|
.006
|
1.350
|
1423
|
.177
|
4.08E-02
|
3.02E-02
|
-1.85E-02
|
1.00E-01
|
| Equal variances not assumed |
|
|
1.293
|
661.968
|
.196
|
4.08E-02
|
3.15E-02
|
-2.11E-02
|
.10
|
| Q13A Instructional
Materials |
Equal variances assumed |
1.736
|
.188
|
1.905
|
1417
|
.057
|
7.37E-02
|
3.87E-02
|
-2.18E-03
|
.15
|
| Equal variances not assumed |
|
|
1.847
|
665.974
|
.065
|
7.37E-02
|
3.99E-02
|
-4.65E-03
|
.15
|
| Q14A Unfamiliar
With Chinese Vocabulary |
Equal variances assumed |
3.948
|
.047
|
2.700
|
1425
|
.007
|
9.59E-02
|
3.55E-02
|
2.62E-02
|
.17
|
| Equal variances not assumed |
|
|
2.630
|
690.673
|
.009
|
9.59E-02
|
3.65E-02
|
2.43E-02
|
.17
|
| Q15A Setting
Exercise & Test |
Equal variances assumed |
.372
|
.542
|
2.465
|
1426
|
.014
|
9.51E-02
|
3.86E-02
|
1.94E-02
|
.17
|
| Equal variances not assumed |
|
|
2.402
|
688.099
|
.017
|
9.51E-02
|
3.96E-02
|
1.74E-02
|
.17
|
| Overall Problem |
Equal variances assumed |
2.649
|
.104
|
3.068
|
1378
|
.002
|
8.003E-02
|
2.608E-02
|
2.89E-02
|
.1312
|
| Equal variances not assumed |
|
|
2.972
|
640.326
|
.003
|
8.003E-02
|
2.693E-02
|
2.72E-02
|
.1329
|
Next Page
Last Page
Content Page
|